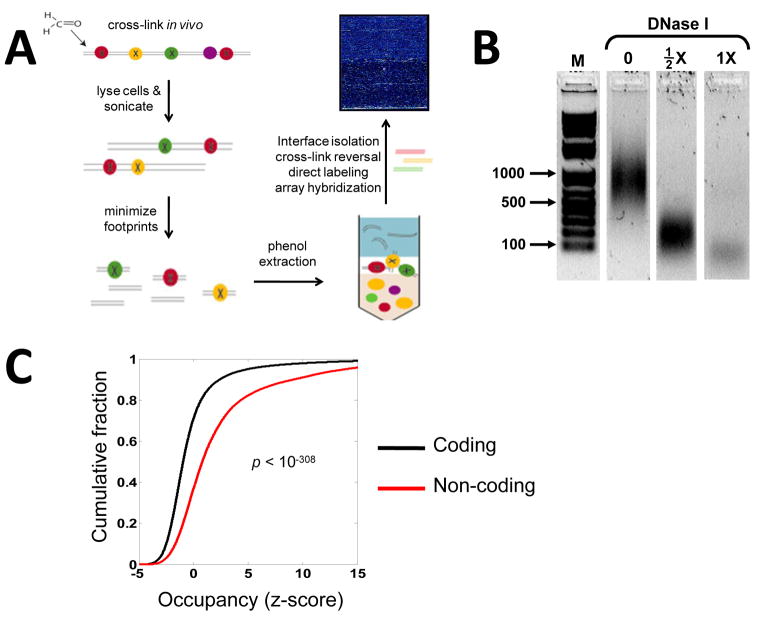
Figure 1. In vivo protein occupancy display (IPOD).
(A) Schematic for isolation and genome-wide display of protein-bound sites across a bacterial genome. Formaldehyde cross-linking preserves in vivo protein-DNA interactions. Following cell-lysis and sonication, protein footprints are minimized through DNase I treatment. Phenol extraction enriches for protein-DNA complexes at the interface between the aqueous and organic phases. Following interface isolation, cross-links are reversed, the resulting DNA fragments are end-labeled and hybridized to a tiling array. (B) Gel-fractionation shows that DNase I treatment leads to a drop in the mode of fragment-length distribution from ~1000 bp (no DNase I) to ~200 bp (½X DNase I), to below 100 bp for (1X DNase I). The samples were separated on the same gel and extraneous lanes were removed for clarity. (C) Cumulative probability distribution of occupancy (z-score: standard deviations from the mean) for both coding and non-coding regions determined during late exponential phase growth. The z-score values were smoothed by averaging within a moving window of 128 base pairs.

