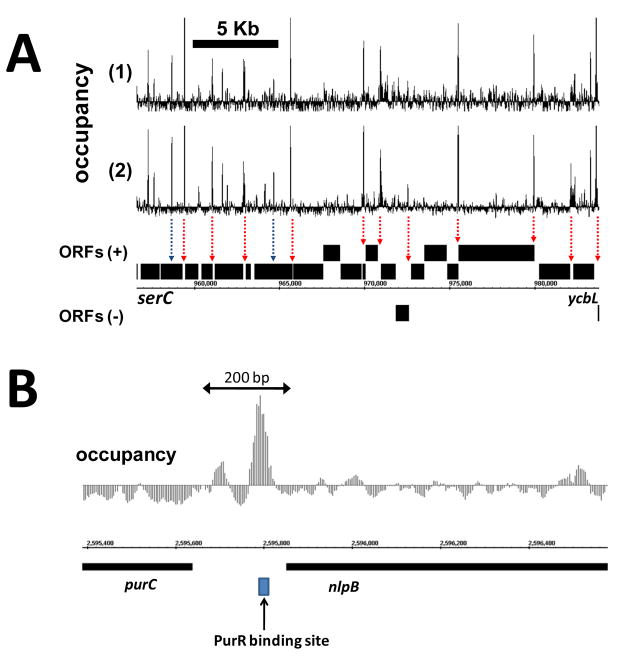
Figure 2. Protein occupancy profile of the E. coli genome during late exponential phase growth.
(A) At low spatial resolution, high-amplitude occupancy peaks are largely confined to intergenic (non-coding) regions of the genome (red arrows). However, similar peaks can less frequently be seen within coding regions as well (blue arrows). Two independent biological replicates show highly reproducible occupancy profiles across this region. (B) At high spatial resolution, multiple occupancy peaks are discernable within a single intergenic region. Peaks are localized to the typical footprint of individual transcription factors and often overlap experimentally determined binding sites (PurR, RegulonDB).

