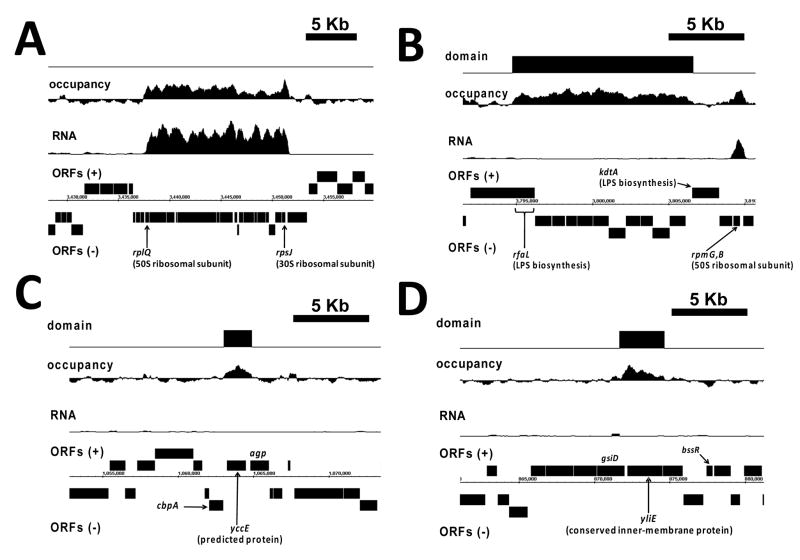
Figure 3. Extended protein occupancy domains (EPODs).
Protein occupancy and RNA expression profiles are shown for early exponential phase growth, smoothed by averaging within a moving window of 512 base pairs. At the bottom, open reading frames (ORFs) are annotated on both strands. Automatically detected transcriptionally-silent EPODs are shown at the top. (A) A high protein occupancy and high RNA expression domain encompassing a region with genes encoding ribosomal protein subunits. (B) An EPOD automatically detected within a transcriptionally-silent region with genes encoding LPS biosynthesis products. A neighboring region encoding 50S ribosomal protein subunits (rpmG and rpmB) shows an equal level of protein occupancy but shows a high level of RNA expression. (C,D) Transcriptionally-silent EPODs detected within genes of unknown function encoding a predicted protein, yccE (C) and a conserved inner membrane protein, yliE (D).

