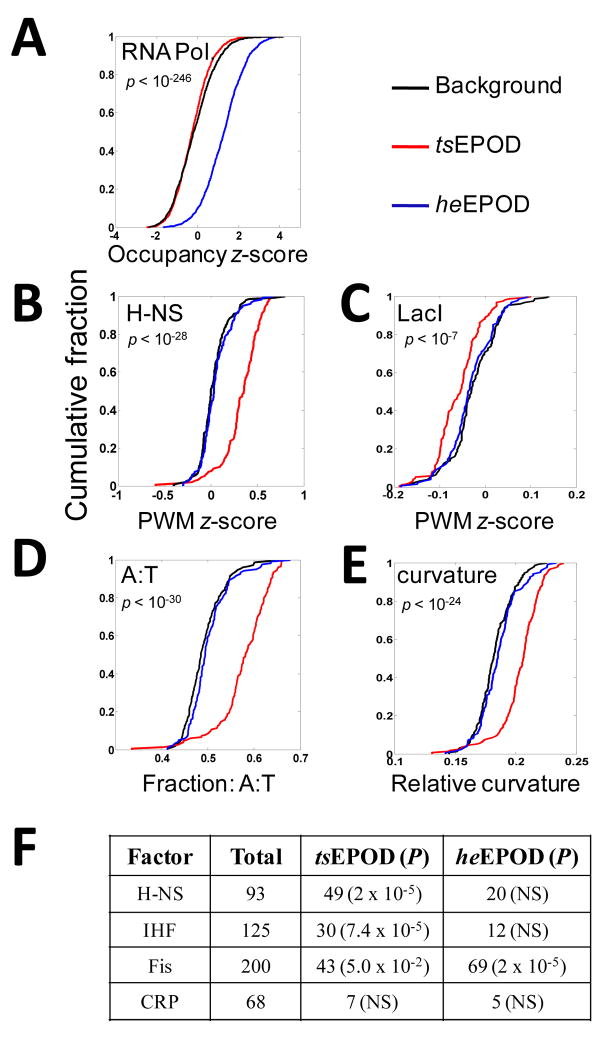
Figure 4. Distinct occupancy composition and biophysical properties within extended protein occupancy domains.
The cumulative distribution of various measures are shown for transcriptionally-silent EPODs (red), highly-expressed EPODs (blue), and a matched background control (black). The Wilcoxon rank sum test is used to determine statistical significance of observed deviations relative to background. (A) Experimentally-determined relative RNA polymerase occupancy. (B,C) Computationally-scored PWM binding preference for a nucleoid protein (H-NS) and a non-nucleoid transcriptional repressor (LacI) using a genome-wide relative measure (z-score). (D) Cumulative distributions of A:T frequencies within EPODs. (E) Cumulative distribution of predicted relative curvature values within EPODs. (F) Distribution of binding sites for various nucleoid proteins and CRP within tsEPODs and heEPODs.

