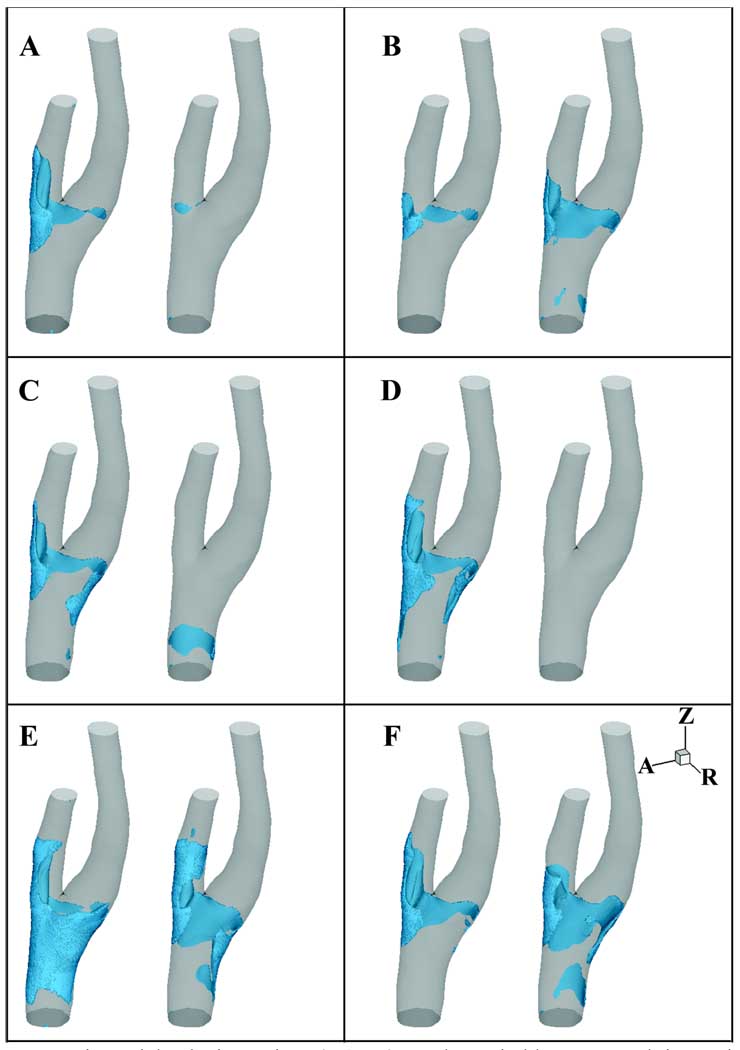
Figure 5.
Negative axial velocity regions (NAVR) are shown in blue at several time points: A) initial systolic acceleration (t1), B) immediately prior to peak systole (t2), C) initial systolic deceleration (t3), D) mid-systolic deceleration (t4), E) minimum flow rate (t5), and F) mid-diastole (t6). Within each panel the left figure is from Simulation 1, and the right is from Simulation 2.

