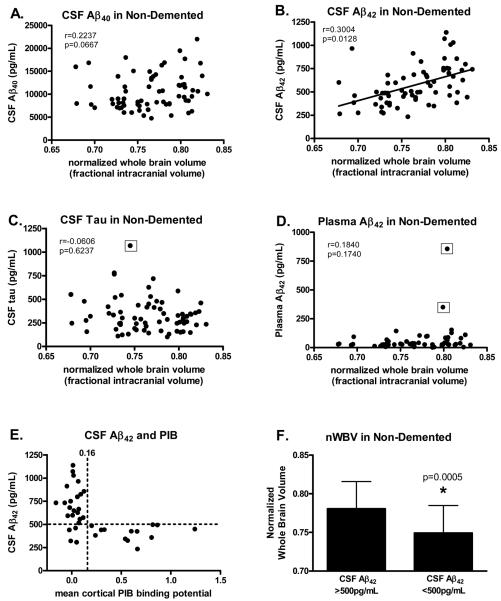
Figure 1.
Scatterplots showing the relationship between the various fluid and imaging measures in non-demented (CDR 0) subjects (n=69). Normalized whole brain volume (nWBV) in non-demented subjects is not correlated with levels of (A) CSF Aβ40, (C) CSF tau (even when the outlier is omitted, r=−0.0280, p=0.8210), or (D) plasma Aβ42 (even when the two outliers are omitted, r=0.0150, p=0.9170), but is positively correlated with (B) CSF Aβ42. E) In the subset (n=37) of subjects in this study who underwent in vivo amyloid imaging with Pittsburgh Compound B (PIB), all subjects with cortical amyloid (PIB-positive, mean cortical PIB binding potential ≥0.16) had low levels of CSF Aβ42 (<500 pg/mL) whereas the majority (83%) of PIB-negative subjects (mean cortical PIB binding potential <0.16) had high CSF Aβ42 (>500 pg/mL). F) As a group, non-demented subjects with CSF Aβ42 <500 pg/mL had significantly smaller brain volumes than subjects with CSF Aβ42 ≥500 pg/mL. CSF tau and plasma Aβ42 values surrounded by the open squares in panels C and D, respectively, indicate statistical outliers as defined by the Mahalanobis Distance and Cook's Distance methods.33

