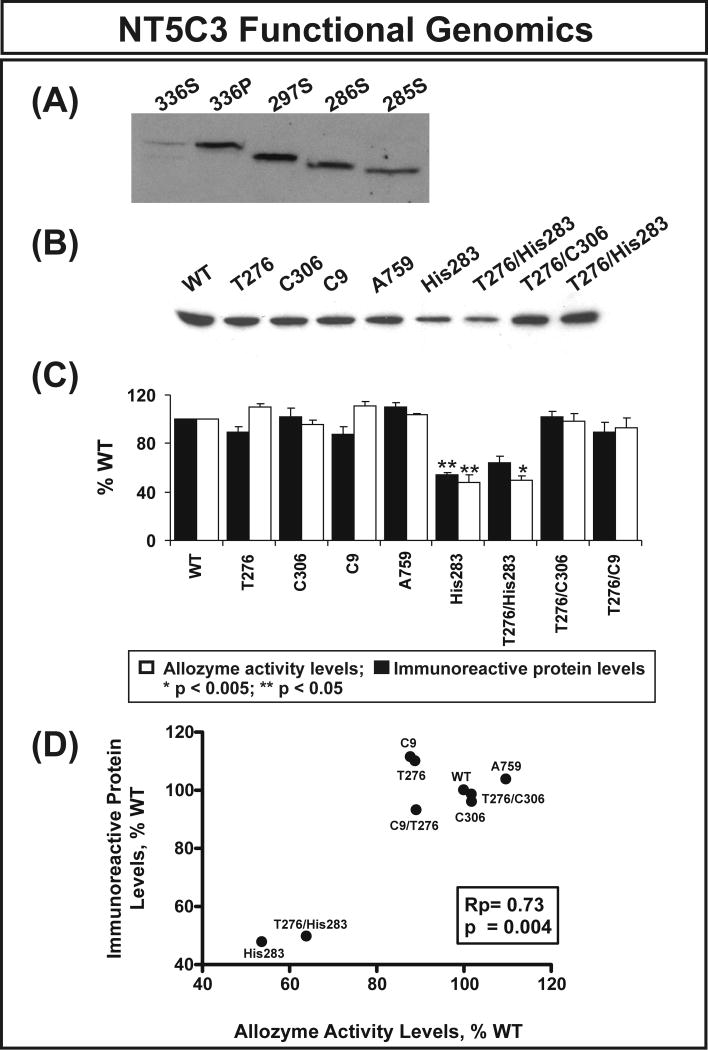
Figure 2.
NT5C3 allozyme functional genomics. (A) Western blot analysis with anti-HA antibody for four different NT5C3 isoforms. Expression constructs encoding 4 different transcripts were transfected into COS-1 cells. Cells were then lyzed and cell supernatant (S) and pellet (P) were used for the analysis as indicated. (B) Representative Western blot analysis for the nonsynonymous and synonymous cSNPs studied. (C) Levels of NT5C3 allozyme activity and immunoreactive protein as a percentage of WT. Each bar represents the average of 6 independent transfections (mean±SE). All values were corrected for transfection efficiency. (D) Correlation between average levels of NT5C3 immunoreactive protein and enzyme activity.

