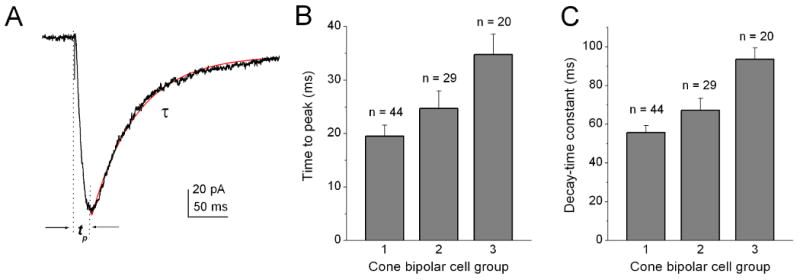
Figure 4. Comparison of the kinetic properties of T-type currents among three subgroups of isolated T-rich cone bipolar cells.

(A) Typical recording of T-type currents in T-rich cone bipolar cells and measurement of time-to-peak (tp) values and the inactivation time constant (τ). The currents were evoked by a voltage pulse to −40 mV from a holding potential of -80 mV in the presence of 10 mM Ca2+. (B) Average time-to-peak value and inactivation time constant of T-type Ca2+ currents recorded from the three subgroups of T-rich cone bipolar cells. Error bars indicate the SD.
