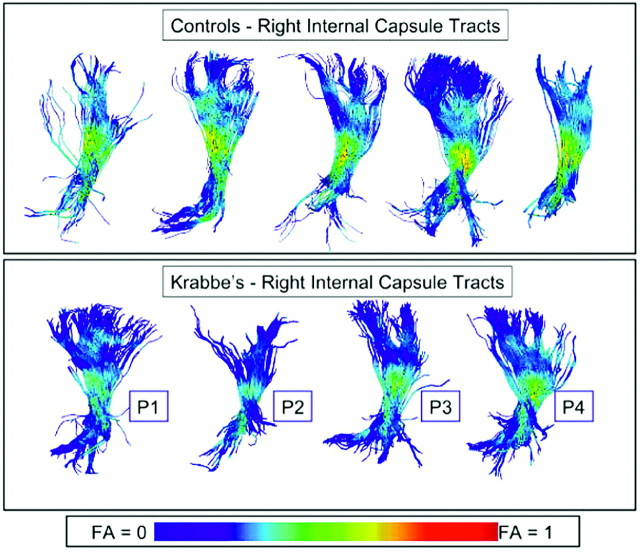
Fig 1.
Visualization of DTI fiber tracts through the right hemispheric internal capsule with FA coloring of the fibers from a lateral viewpoint. Top row: 5 representative control subjects. Bottom row: 4 selected Krabbe subjects. Visually, all Krabbe subjects show lower FA values along most of the fiber bundle than any of the controls.

