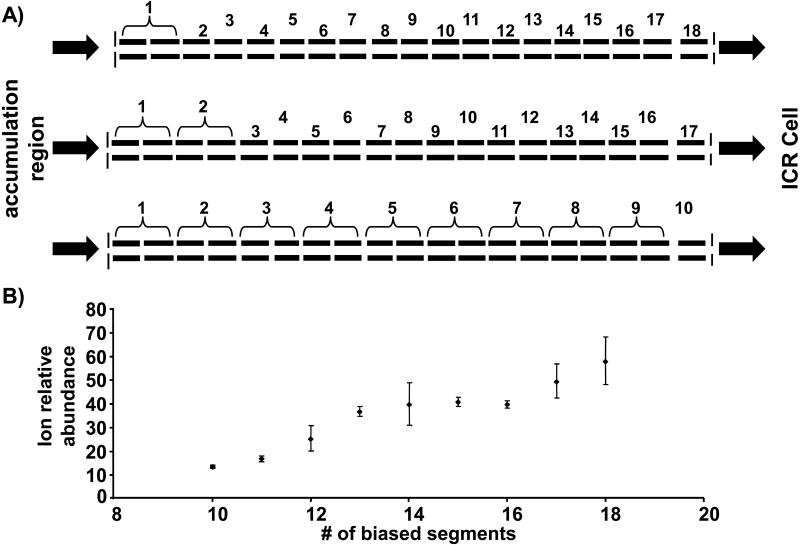
Figure 3.
A) A visual representation of how the segments were coupled together for the different total number of applied DC bias voltages. B) The combined signal magnitude as a function of number of independent DC bias voltages that were applied during the RIPT transfer method. The error bars represent + and - one standard deviation.

