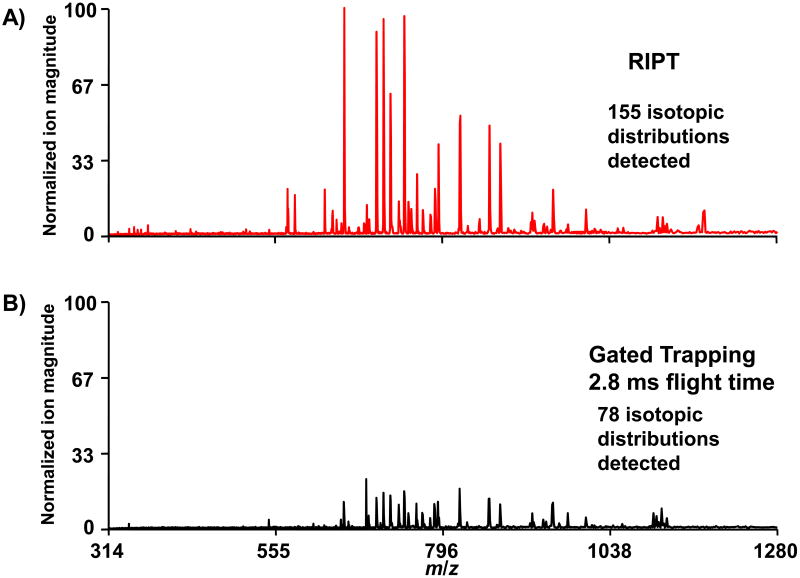
Figure 4.
ESI-FTICR mass spectra taken with the RIPT method (A) and gated trapping with a flight time of 2.8 ms (B) are shown. The y-axes in both spectra are normalized to the most strong peak in the spectrum obtained with the RIPT method. A 3-fold improvement in signal magnitude is observed with the RIPT method for the same ion accumulation time period.

