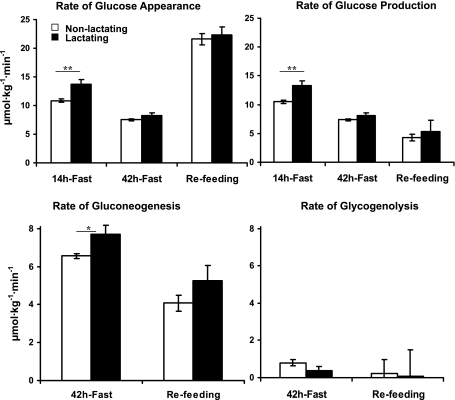
Fig. 3.
Rates of glucose appearance, glucose production, gluconeogenesis, and glycogenolysis in the nonlactating (□) and the lactating (▪) women following 14 and 42 h of fasting and 6 h of refeeding. Values are means ± SE. All parameters are expressed as μmol·kg−1·min−1. All calculations are based on total body weight (kg). *P (nonpaired) < 0.05; **P (nonpaired) < 0.01, nonlactating (n = 6) vs. lactating (n = 6) women.

