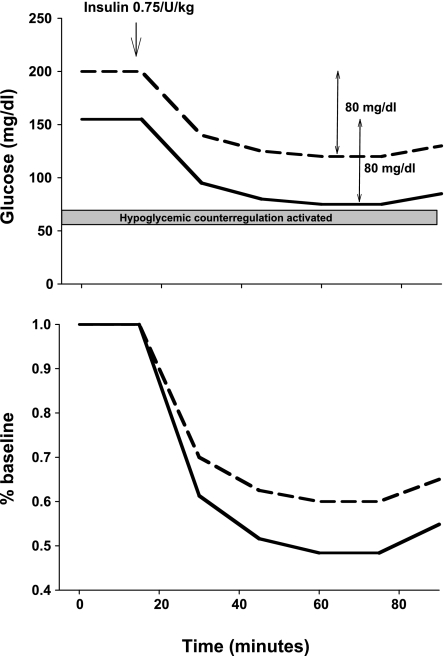
Fig. 2.
Hypothetical insulin tolerance test is administered to two animals with differing baseline glucose concentrations. Glucose concentration is expressed either as absolute glucose concentration (top) or as percent baseline (bottom). Top: absolute decrement in glucose was equivalent (80 mg/dl). In one animal, the glucose concentration decreased to near the threshold for glucose counterregulation. Bottom: percent fall in glucose concentration was greater in the animal with the lower incoming glucose.

