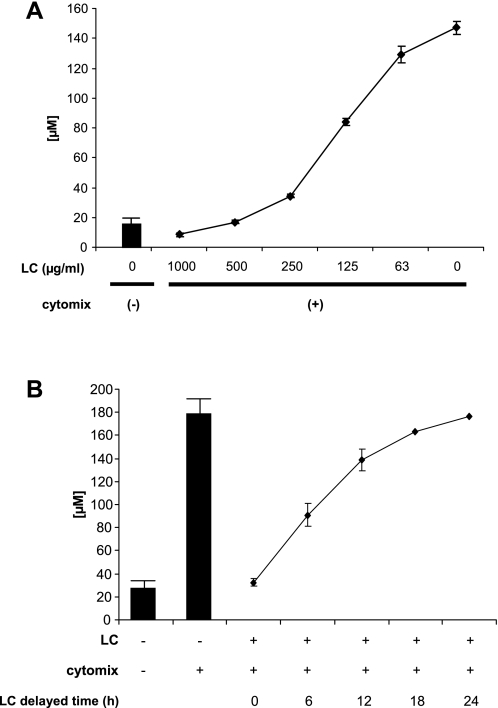
Fig. 2.
The suppressive effect of LC on NO• production is dose dependent and is apparent when LC is added after the inflammatory stimulus. A: a dose-response curve of LC-iNOS inhibition was generated by adding 0–1,000 μg of LC per milliliter to Caco-2 monolayers exposed to cytomix for 24 h. The y-axis represents the amount of NOx released from cells during the time period. B: the ability of LC (400 μg/ml) to inhibit NO• production was tested by adding LC to the basolateral surface of the cultures at times indicated following addition of cytomix.

