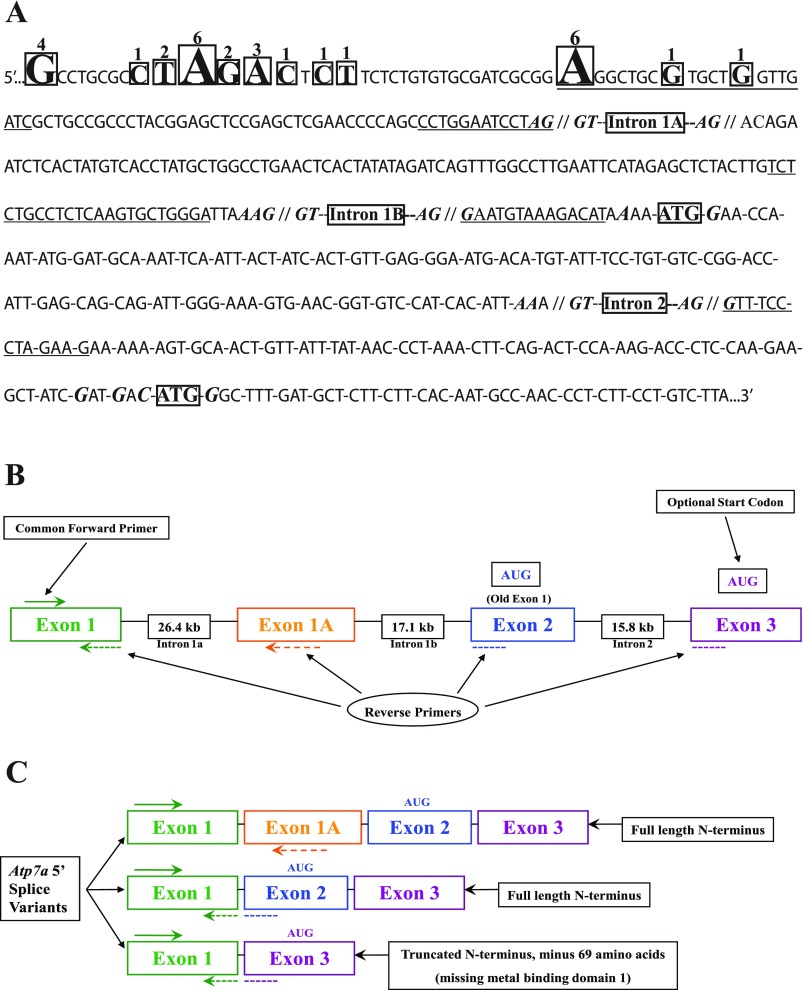
Fig. 4.
Sequence of the 5′ end of the rat Atp7a gene and schematic diagram of gene structure. A: gene sequence (including new exon 1, novel exon 1a, exon 2 and a portion of exon 3) starting from the 5′ end of the longest RACE clone obtained. Boxed nucleotides indicate the 5′ end most base of various clones and numbers over bases indicate the number of clones (out of 29 total) that began with that particular base. Underlined sequences are the bases that were targeted for PCR amplification. Bolded, italicized bases near the intron/exon boundaries indicate consensus splice site bases, whereas bolded, italicized bases near the ATG codons indicate consensus Kozak sequences. Introns are also indicated. B: gene structure and the relative location of PCR primers used to quantify the expression of the various transcript variants during iron deficiency. AUG, in-frame start codon. C: alternative transcripts and the potential protein variants that would be encoded by them.

