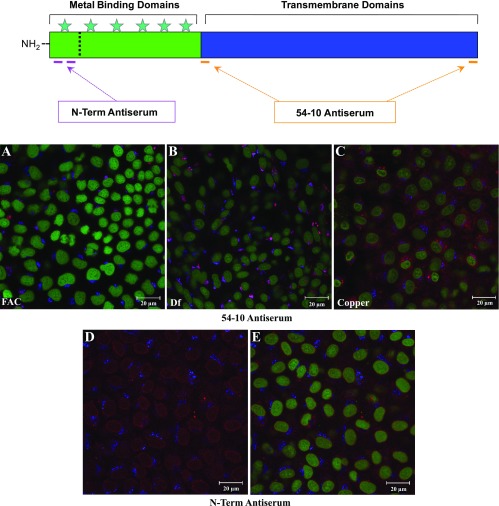
Fig. 6.
Immunocytochemical analysis of postconfluent IEC-6 cells with Atp7a antisera. Top: basic scheme for antibody production; stars indicate copper-binding domains. A–C: typical images from cells treated with FAC, Df, or copper. Triple labeling was done with Atp7a (54–10 antiserum; 647-nm laser line; red color), Golgi 58K (568-nm laser line; blue color), and Sytox Green (488-nm laser line; green color). D and E: reaction of the cells with the N-term antiserum. Triple labeling was done again (as for the cells shown in A–C); only the blue and red channels are shown in D, whereas all 3 channels are shown in E.

