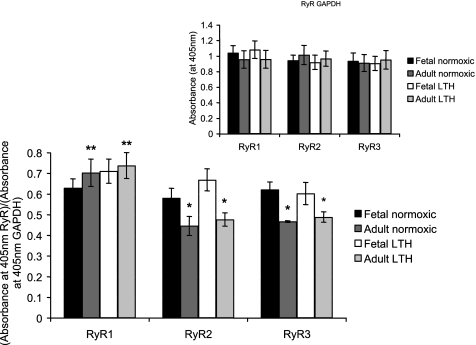
Fig. 5.
Impact of maturation and LTH on cellular levels of RyR1, RyR2, and RyR3 isoforms in ovine SCG cells. RyR isoforms levels were quantified using ELISA and normalized to GAPDH (see materials and methods). Inset: GAPDH controls. Data are means ± SE; n = 8 ganglia from 8 normoxic adults and 8 LTH adults, 16 ganglia (2 ganglia pooled for each experiment) from 8 normoxic fetuses, and 16 ganglia (2 ganglia pooled for each experiment) from 8 LTH fetuses. Each experiment was performed in triplicate. *Significantly different from the normoxic or hypoxic fetus (P < 0.05 by ANOVA and Fisher's PLSD test); **significantly different from two other isoforms (P < 0.01 by ANOVA and Fisher's PLSD test).

