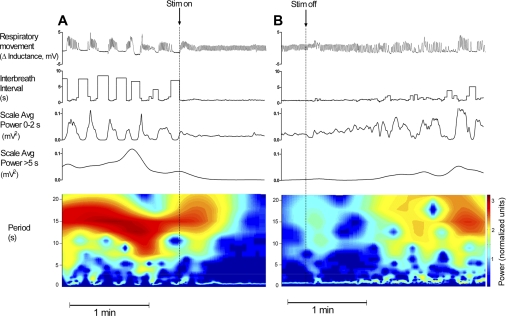
Fig. 5.
Example (infant 3) of temporal changes in breathing patterns after the onset of stimulation and offset of stimulation. A: onset of stimulation (at the end of the 10-min off interval) was associated with a rapid switch from periodic to regular breathing (top), with was associated with reduced variability in IBI and in wavelet-derived power ≤2 s and reduced power of periodicities >5 s. B: offset of stimulation (at the end of the 10-min on interval) was associated with a gradual (over ∼1 min) evolution in the breathing pattern from eupnea to a progressively less stable pattern with increasing variability in IBI and wavelet power <2 s and a rise in wavelet power >5 s, which corresponded to the emergence of periodic breathing and apnea pattern. The bottom images show the contour plot of wavelet power. The color scale was mapped to log of normalized power using the normalized energy function (65). Note the complex temporal evolution of a range of periodicities, induced by the onset and offset of stimulation.

