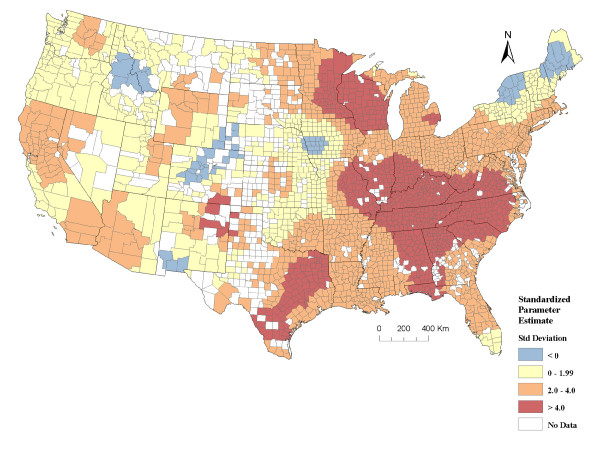
Figure 4.
County level standardized parameter estimates from a geographically-weighted regression, analyzed at a 200 km distance band comparing age-adjusted average annual incidence rates (2000/2001-2004/2005) of breast and prostate cancers adjusting for the county unemployment rate. In total there were 2651 counties included in the analysis. The counties with no color are those with either no data or counts less than 3-5. Counties depicted in orange and red indicate statistically significant positive parameter estimates (i.e. positive relationship between the two cancers). Data sources: National Cancer Institute-State Cancer Profiles and State Cancer Registries and USDA Economic Research Service. (Std Standard).

