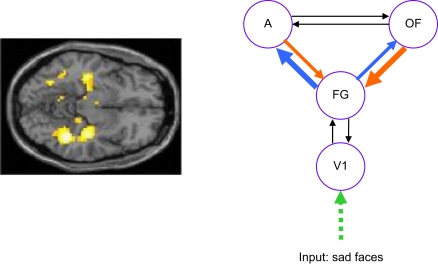
Figure 3.
Sad face processing in remitted depressed patients. The left panel shows attenuated bilateral hippocampus and fusiform signal in patients compared to controls. The right panel shows altered connectivity in patients obtained via dynamic causal modelling. The model tested was a right hemisphere model comprising primary visual cortex (V1), fusiform gyrus (FG), Amygdala (A) and orbitofrontal cortex (OFC). Connections shown in blue are stronger in patients (significant at p < 0.05 corrected for boldest arrow) while those in orange are weaker in patients (significant at p < 0.05 corrected for boldest arrow). Data acquired at the Wellcome Trust Clinical Research Facility, Manchester (Thomas et al., submitted; Goulden et al., 2009).

