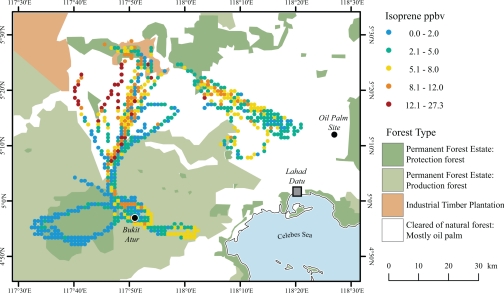
Fig. 1.
The aircraft flight tracks in the boundary layer for the data averaged in Fig. 2, colored by isoprene concentrations (ppbv). The markers are at 10-s intervals with the 15-s isoprene data merged onto this time stamp. Each marker represents a single measurement, and there are only a small number of instances, mostly around 5.05° North, 117.8° East, where several points overlay each other.

