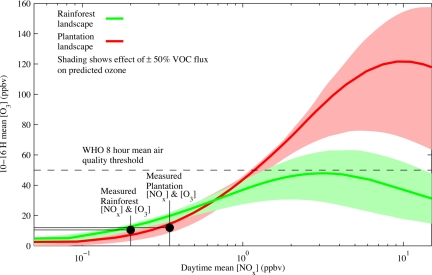
Fig. 4.
Sensitivity of daytime (10.00–16.00 hours) average ozone concentration to concentrations of NOx in the boundary layer, for the isoprene and monoterpene emission rates measured at the rainforest and oil palm landscapes, as computed by CiTTyCAT. Each model run has a similar shape but with a different point of inflection, so the solid lines are not always in the centre of the shaded region. Current measured concentrations of NOx and O3 in the rainforest and plantation are marked.

