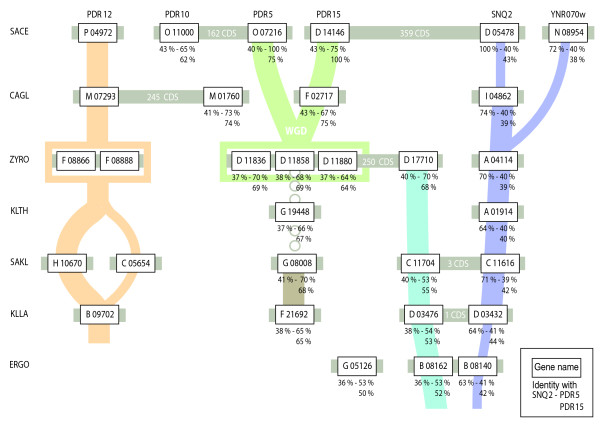
Figure 3.
Relationships between the PDR sensu stricto based on the neighborhood analysis. Each box represents a PDR gene. Grey lines join PDR genes located on the same chromosome. When non-adjacent, the number of coding sequences between two PDR genes is noted in white. Note that SAKL0C05654g, SAKL0C11616g and SAKL0C11704g are on the same chromosome. Shared neighborhoods are represented by connectors whose colors match those of Figure 1. Two colors were used for SONS b in order to distinguish the lineage of ZYRO0D17710g and the one of Snq2 and YNR070w. A large connector links PDR genes sharing more than one common neighbor while a thin connector links PDR genes sharing one neighbor only. Dotted connectors link genes whose relationship is based on phylogenic evidence only. For the story leading to Pdr5/15 and Snq2, the percentage of identity with their homologs in the other species is given. The label WGD stands for Whole Genome Duplication. Our representation does not imply that the present ERGO species is the ancestor of all the other species we analyzed.

