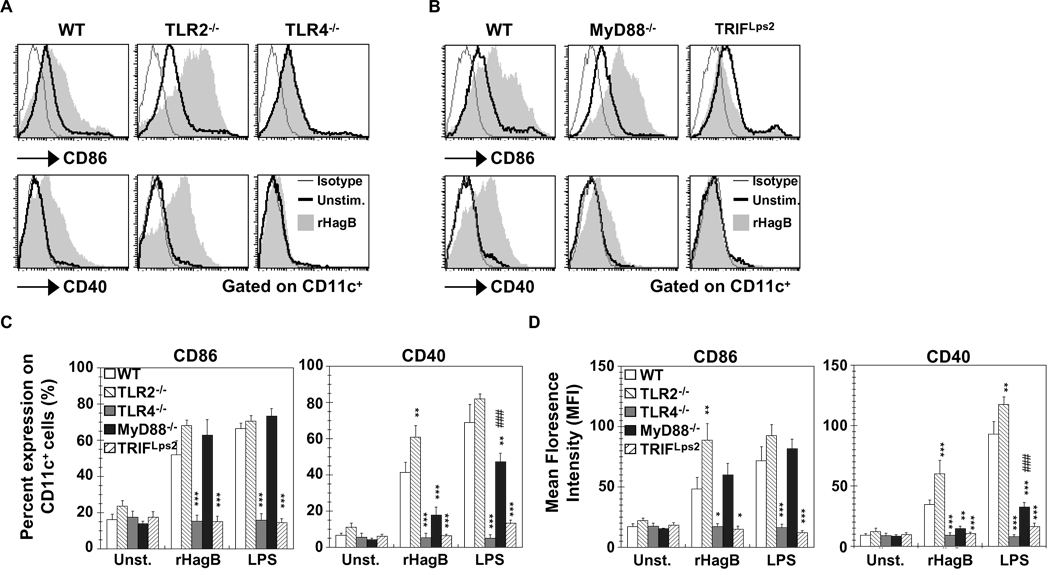
Fig. 7.
Upregulation of CD86 and CD40 with rHagB stimulation is mediated through TLR4 and TRIF signaling. DC (2×10⁵) from WT, TLR2−/− and TLR4−/− mice (A, C and D), or WT, MyD88−/− and TRIF Lps2 mice (B, C and D) were stimulated with 40 µg/ml rHagB (shaded histograms), 100 ng/ml E. coli K12 LPS or left unstimulated (thick lines) for 16 h. Cells were harvested and stained with fluorescent-labeled antibodies to CD11c, CD86, CD40 or matched isotype controls (thin lines). Histogram plots were gated on CD11c+ cells. Data in (C) and (D) are expressed as the percentage of CD86 and CD40 positive cells and the mean florescence on CD11c+, respectively. Results are expressed as the mean ± standard error of four independent experiments. ***, ** and * Significant differences at P < 0.001, P < 0.01 and P < 0.05, respectively, compared to WT cultures stimulated with rHagB or LPS. ### Significant differences at P < 0.001 compared to unstimulated MyD88−/− cultures.

