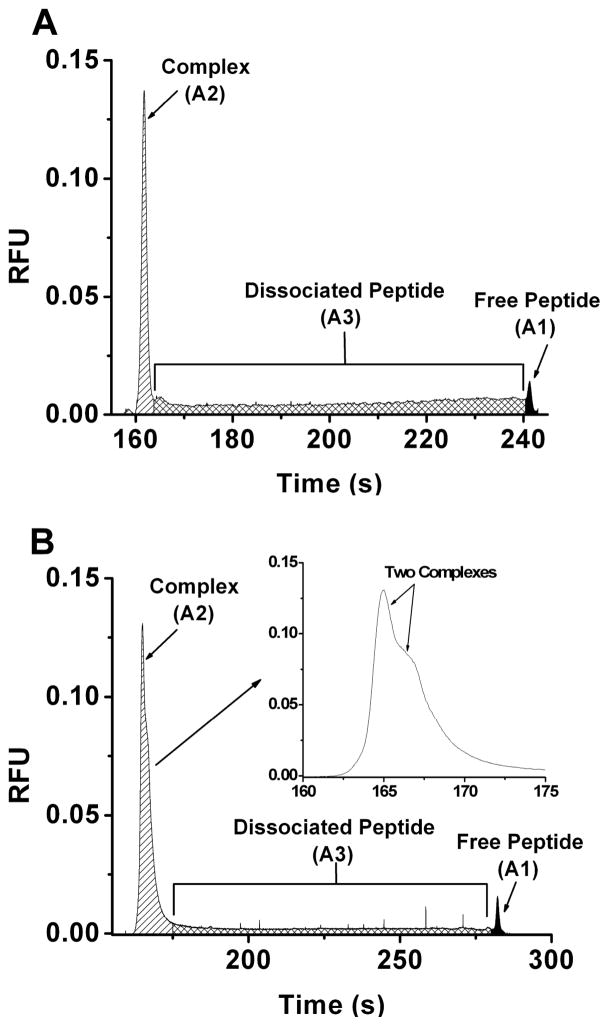
Figure 3.
NECEEM electropherograms used in determination of koff for Fyn-SH3-SH2 (A) and GST-Fyn-SH3-SH2 (B). Sample contained 1 μM Fyn-SH3-SH2 (A) or 2 μM GST-Fyn-SH3-SH2 (B) and 100 nM Fluor-Fyn peptide and 10 nM rhodamine 110. Areas marked correspond to bound peptide (A2), peptide that dissociated during the separation (A3) and the peptide that was free in the sample solution (A1). The inserted panel in B shows enlarged complex peak. Separation conditions and calculations of koff are described in the Experimental Section under NECEEM Assays.

