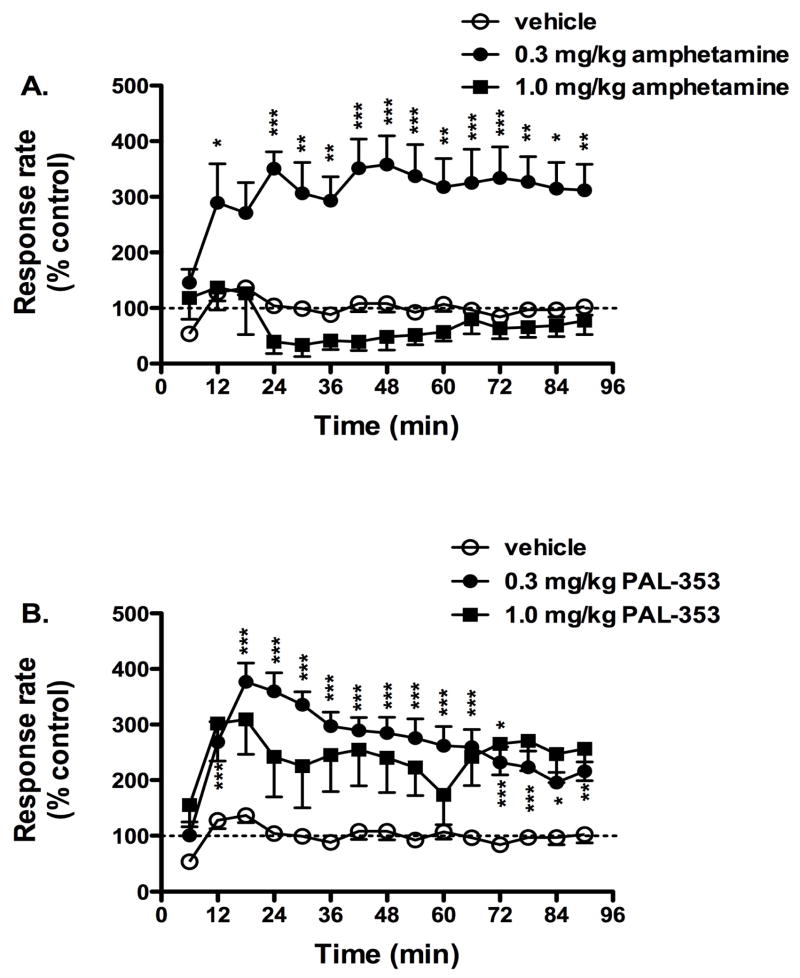
Figure 4.
Time course of increases in rates of responding following i.m. administration of 0.3 mg/kg or 1.0 mg/kg amphetamine (panel A) or 0.3 mg/kg or 1.0 mg/kg PAL-353 (panel B). Data (mean ± SEM) are presented as a percent of the rate of lever pressing following i.m. administration of saline. The dotted line represents baseline responding rates following i.m. administration of saline. *** p < 0.001, ** p < 0.01, * p < 0.05, as compared to vehicle at that time point using Bonferroni post-hoc tests.

