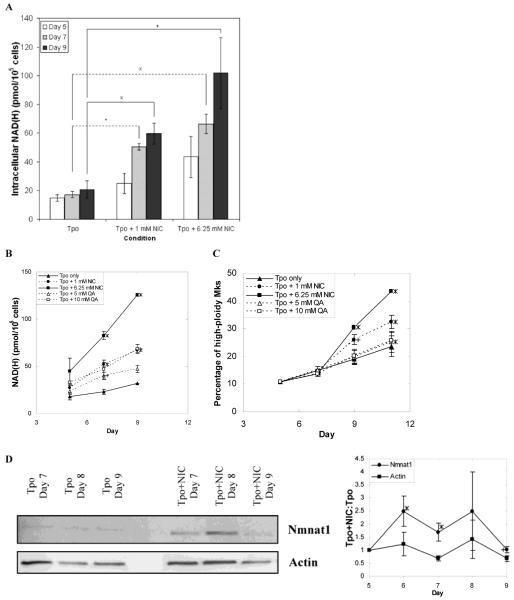
Figure 3.
Effects of NIC and quinolinic acid (QA) on intracellular NAD(H) content, Mk ploidy, and Nmnat1 levels. (A) Intracellular NAD(H) levels in cells cultured with Tpo only, Tpo + 1 mM NIC, or Tpo + 6.25 mM NIC were measured using a cycling enzymatic assay on days 5 (4 h after NIC addition), 7, and 9. Data shown are the mean ± SEM of n = 7 (day 7) or n = 5 (days 5 and 9) experiments. Based on a paired t-test, values of p < 0.005 (x), p < 0.05 (*) and p < 0.1 (+) are indicated in comparison to the Tpo only treatment. (B-C) mPB CD34+ cells were cultured with 100 ng/mL Tpo. Beginning on day 5, cells were treated with either NIC or QA. (B) NAD(H) levels were measured on days 5 (4 h after addition), 7, and 9. (C) The percentage of high-ploidy Mks was determined on days 5, 7, 9 and 11. (B-C) Data shown are the mean ± SEM of 2 experiments. Based on a paired t-test, values of p < 0.05 (*) and p < 0.1 (+) are indicated in comparison to the Tpo only treatment. (D) Western blot (representative of five biological experiments) of nuclear lysates prepared from primary Mks cultured with 100 ng/mL of Tpo only or supplemented with 6.25 mM NIC on day 5 were probed for nuclear NAD processing enzyme Nmnat1 and actin (loading control). The densitometry values for Nmnat1 or actin expression in cells grown with NIC were divided by the densitometry values for Nmnat1 or actin expression in cells grown with Tpo only. The ratios shown correspond to the mean ± SEM of protein expression in whole cell or nuclear lysates harvested from 5 biological experiments. Based on a paired t-test, values of p < 0.05 (*), and p < 0.1 (+) are indicated for the various time points in comparison to actin band density.

