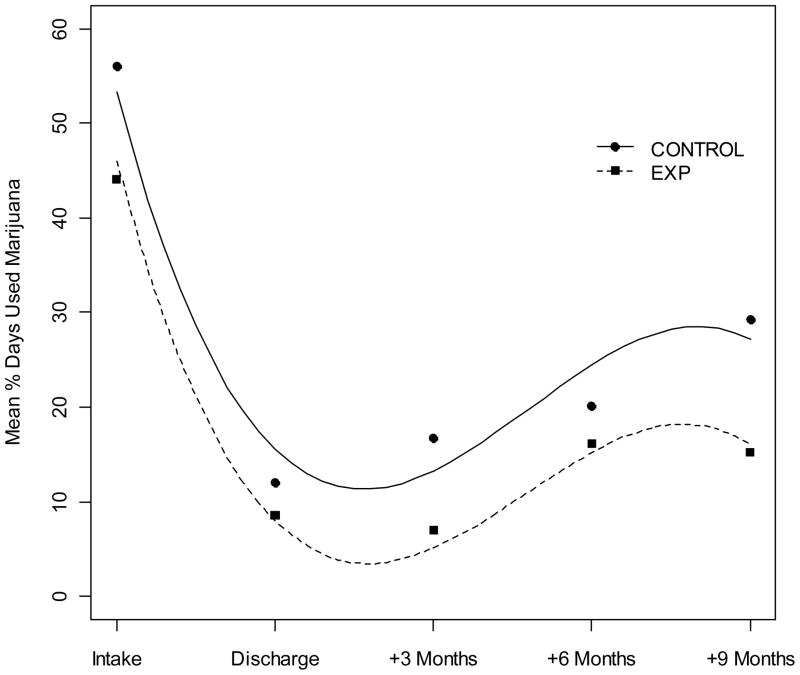
Figure 3.
Mixed model of reported percentage of days used marijuana in the 90 days prior to intake and between each subsequent assessment. Circles and squares represent observed percentages for the CONTROL and EXP conditions, respectively. The estimated cubic curves for each treatment condition are displayed. EXP=Experimental condition; CONTROL=Control condition.

