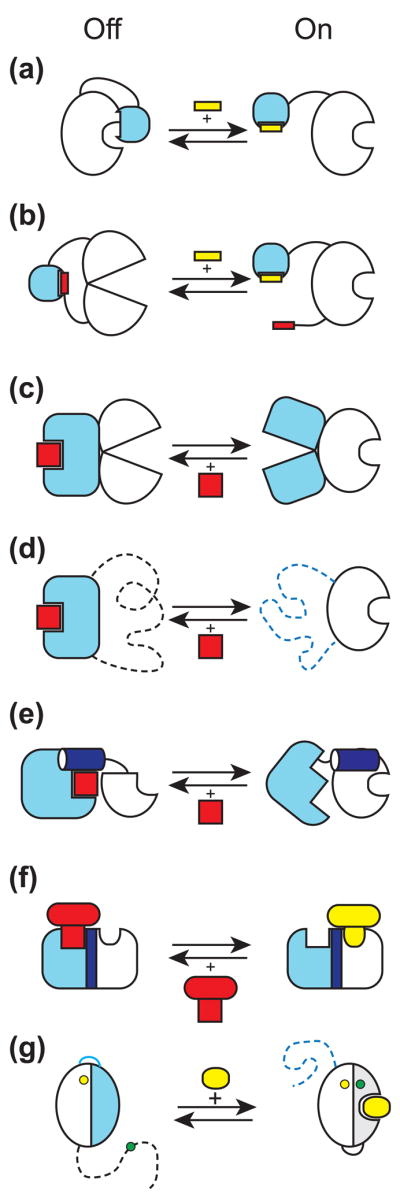
Figure 2.

Molecular mechanisms used to create synthetic regulatory circuits and sensors by module/domain recombination and rearrangement. The input module is shown in light blue and the output module is in white. The output module is in the "on" state on the right side and "off" on the left. An activator is shown in yellow and an inhibitor in red. (a) Steric allostery. The input module physically occludes the active site of the output module, which can be relieved by a ligand (yellow) for the input module. (b) Conformational allostery. Interactions involving the input module and its intramolecular ligand distort the conformation of the output module. A ligand in trans removes the inhibition. (c) Conformational coupling. Two modules are connected in such a way that only one of them is in the active conformation at a given time. A ligand binding to the active state of the input module inhibits the output module. (d) Mutually exclusive folding. The dashed lines indicate unfolded segments. This is an extreme case of conformational coupling depicted in panel c. (e) Segmental overlap creating mutually exclusive folding of a shared helix (shown in dark blue) and thus conformational allostery. A ligand for the input module stabilizes docking of the shared helix to the rest of the input module and thus inactivates the output module. (f) Segmental overlap creating steric allostery. Two modules are fused in such a way that a ligand to the input module (red) physically occludes binding of a ligand to the output module (yellow). (g) Alternative folding frames for creating a sensor. The blue and gray portions denote equivalent segment of the starting protein that has been duplicated. The blue segment is mutated so that it no longer binds to a ligand but it interacts with the rest of the protein more strongly than the gray segment thereby favoring the inactive state (the left side of the arrows). A ligand shifts the equilibrium to the right, which changes the distance between fluorophores (the yellow and green circles).
The schemes (a) and (b) are made after Dueber et al. [31], (e) after Strickland et al. [44] and (g) after Stratton et al. [48].
