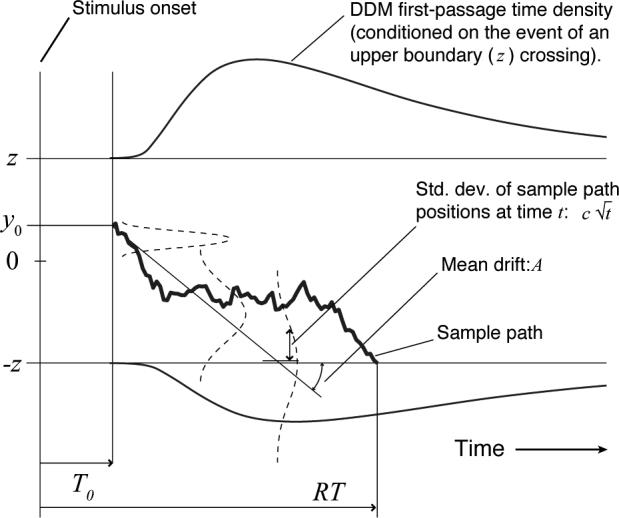
Figure 1.

Parameters, first-passage density and sample path for the extended drift-diffusion model (DDM). The leftmost point of the horizontal, time axis is the time at which stimulus onset occurs. In this example, the drift, which models the effect of a perceptual stimulus, is downward with rate A; y0 is the starting point of the diffusion process. The sample path is an individual random walk in continuous time; the distribution of an ensemble of such paths is shown by the dashed Gaussians that expand vertically as time progresses. Response time distributions are equivalent to the distributions of first-passage times shown as ex-Gaussian-shaped curves above the upper and below the lower threshold (T0 is depicted here as elapsing before the random walk begins, but this is only for simplicity — a component of T0 should follow the first-passage to encode motor latency.)
