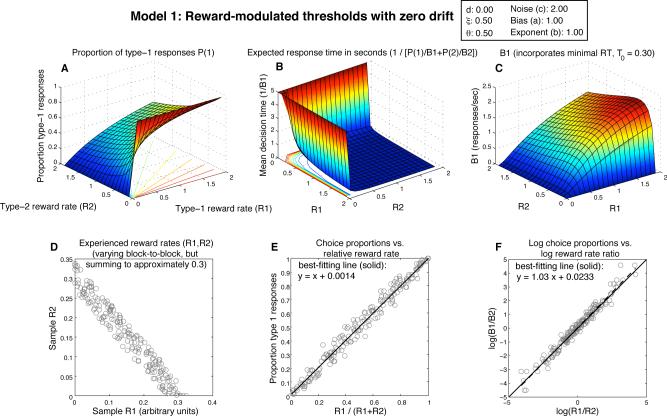
Figure 3.
Expected behavior of Model 1, the zero-drift diffusion model (drift=0) with threshold adaptation (θi = ξ/Ri). A) Surface shows expected proportion of 1-responses as a function jointly of reward rate for 1-responses (R1) and reward rate for 2-responses (R2); radial lines in the R1,R2 plane show contours of constant choice probability. B) Expected response time as a function of R1 and R2; this 3D plot is rotated relative to panels A and C to make the shape of the surface more easily discernible; since its height goes to infinity, it is also truncated to 5 sec. C) Expected 1-response rate (B1) as a function of R1,R2 (notice the collapse to 0 along both the R1 and R2 axes). D) Scatterplot of random R1,R2 pairs, representing blocks of 100 responses in which those reward rates were obtained. E) Scatterplot showing expected choice proportions plotted vs. relative reward rate in those blocks of responses; the best-fitting line (solid) is superimposed, and its equation is displayed. Matching predicts a slope of 1 and intercept of 0 (dashed line). F) Choice ratio B1/B2 plotted vs. the reward ratio R1/R2 on a log-log scale, which is frequently used for highlighting generalized matching behavior. Predicted behavior is plotted as a dashed line; best-fitting line is solid.

