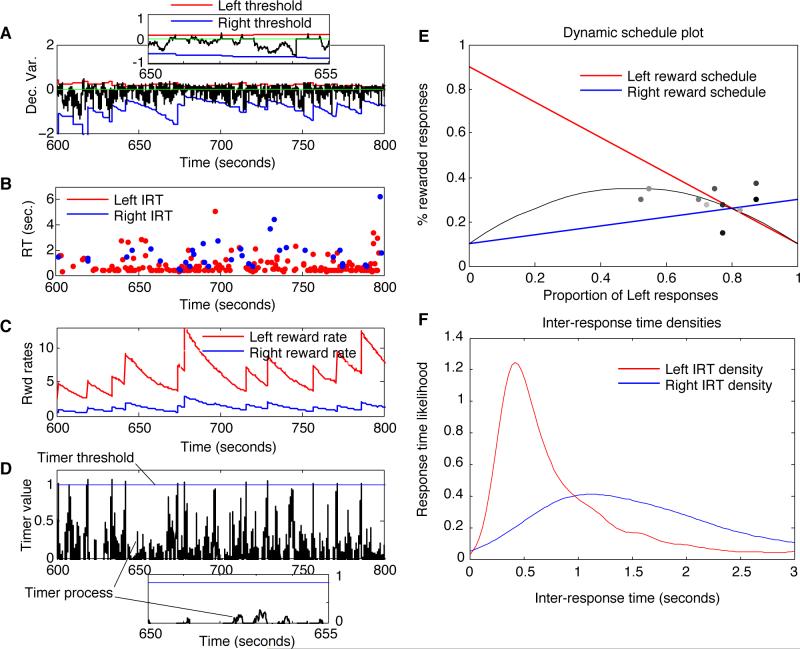
Figure 6.
Melioration by an adaptive-threshold, zero-drift diffusion model in a dynamic, VR-VR task (with threshold explosion controlled by a drift-diffusion timer). A) The diffusion process over the course of many responses. The trajectory of the decision variable is in black, causing Left responses whenever it intersects the upper threshold in red, and Right responses when it intersects the bottom threshold in blue. At each response, it resets to 0 and begins to drift and diffuse again. A 5-sec window is magnified in the inset. B) The plot of inter-response times (IRTs) in seconds. At points where the IRTs jump to a large value, the system is in danger of response-rate collapse (which is prevented by the expiration of a drift-diffusion response timer). C) The two reward rate estimates over time; large jumps indicated potentiation occurring because the response timer elapsed. D) The ‘decision’ variable of the DDM timer, in black, and a fixed threshold in blue. Whenever the timer hits threshold, a weight renormalization takes place. This occurs for three out of the six responses occurring in the magnified, twenty-second window shown in the inset. E) The reward schedules for Left responses (red) and Right responses (blue) as a function of response proportions in the preceding 40 trials (expected reward is in grey). Dots show choice proportion and reward proportion on the previous 40 trials, plotted once every 40 trials; light dots represent points near the beginning of the simulation, while dark dots represent points near the end. F) The IRT distribution for Left (red) and Right (blue) responses — Right IRTs were on average much longer than those for the more preferred Left responses.

