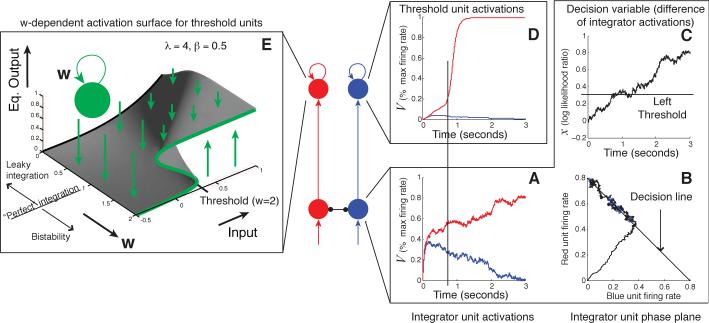
Figure 8.
A two-stage neural network implementing a decision process. The first layer (bottom red and blue units) implements the preference-weighing diffusion process: the two units’ activations are plotted in the box A; these activations are then shown in the phase plane in box B, which depicts the predicted attracting line for the two-dimensional process; box C shows the difference between these activations over time, forming a one-dimensional random walk. The second, bistable layer of units implements response triggers that apply thresholds to this accumulated preference. Self-excitation w creates bistability by transforming the sigmoid activation function from the black curve at the left of the activation surface plot on the left into the green function on the right. The resulting activity is approximately digital, with rates between 0 and 1 occurring only transiently at the time of a threshold crossing.

