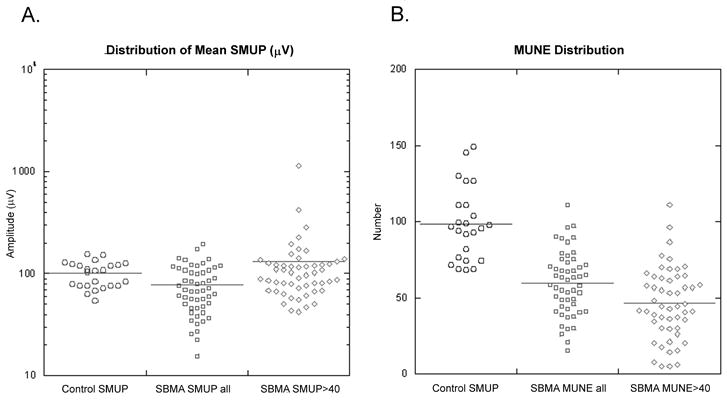
Figure 2. Distribution of Mean SMUP Amplitudes and MUNE.

A. Distribution of mean SMUP amplitude in SBMA and Age-matched controls. The mean SMUP amplitudes were calculated using a number-weighted equation and excluded the very large SMUPs obtained from analyzing the gaps in the SBMA subjects. The control subjects (○) have a mean SMUP amplitude of 101±28 μV. The SBMA subjects had a mean SMUP amplitude of 78±40μV when all SMUP were included (□) and 130±156 μV when SMUPs ≤ 40 μV were excluded (◇).
B. Distribution of MUNE in SBMA and Age-matched Controls. The control subjects (◦) have a mean MUNE of 98±24 (range 68 – 149), compared to SBMA subjects with a mean MUNE of 60±21 (range 15–111) when all SMUPs were included (□) and 47±23 (range 5–111), when SMUPs ≤ 40 μV were excluded (◇).
