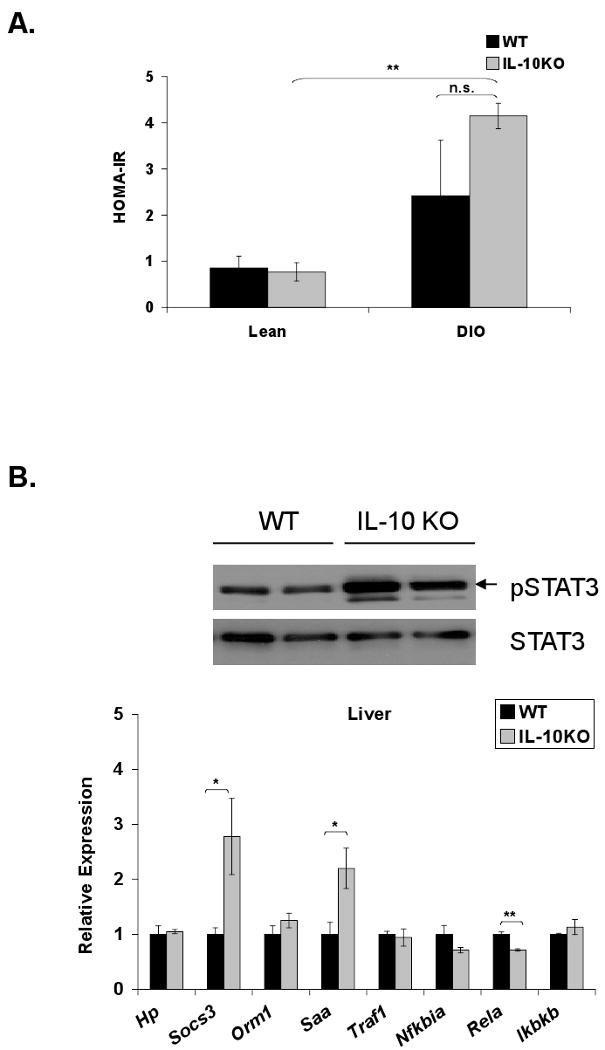
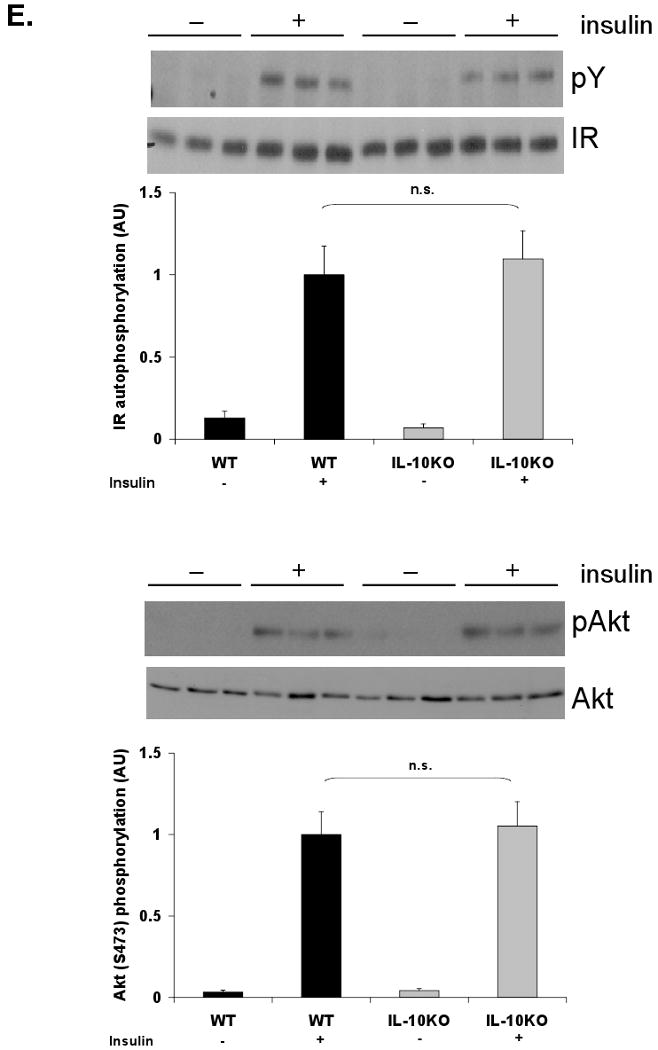
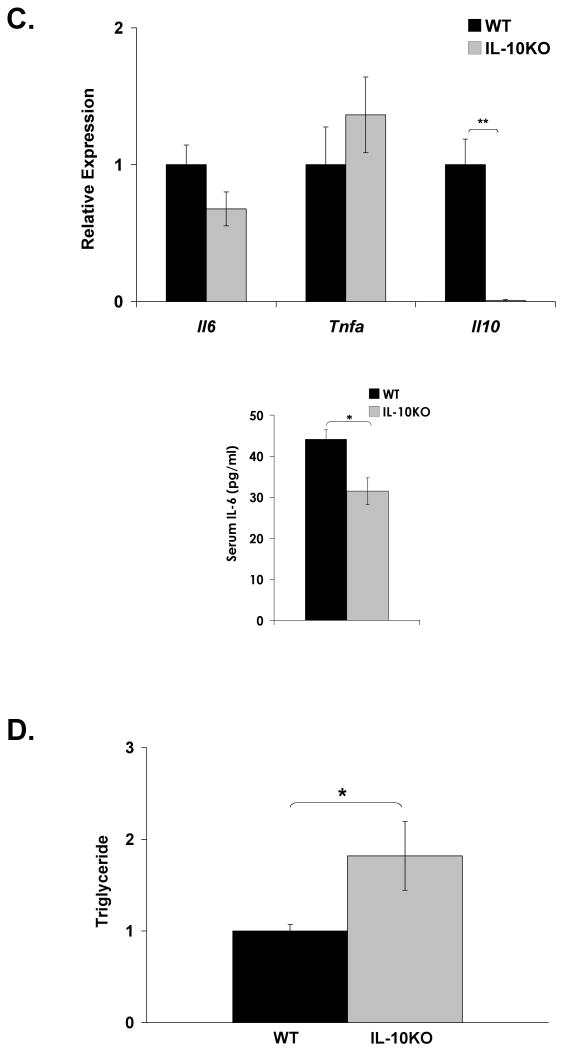
Figure 6. DIO IL-10 knockout mice do not display altered hepatic insulin responsiveness.


IL-10 knockout (IL-10KO) and wild-type (WT) mice were fed a high-fat diet for 8 weeks. A) HOMA-IR was calculated from glucose and insulin concentrations of 16-h fasted WT and IL-10KO mice (mean ± S.E. of n≥4). B) Western blot analysis for phosphorylation of STAT3 (Y705) was performed on whole cell extracts from WT and IL-10KO mouse liver. Hepatic expression of IL-6-responsive genes and TNF-α responsive genes was assessed by realtime RT-PCR (mean ± S.E. of n=6). C) Hepatic cytokine expression was assessed by realtime RT-PCR (mean ± S.E. of n=6). Circulating IL-6 levels were measured by a Luminex® Beadlyte® assay (mean ± S.E. of n=6). D) Hepatic triglyceride content (mg/wet weight) was quantified in WT and IL-10KO mice and normalized to protein (mg/wet weight) (mean ± S.E. of n=11). High-fat-fed WT and IL-10KO mice were fasted overnight prior to an i.p. injection of insulin (1.5 Units/kg). Tissues were harvested after 10 min. E) Tyrosine phosphorylation of the insulin receptor (IR) and Akt Ser473 phosphorylation in livers of WT and KO mice were assessed by Western blot analysis (mean ± S.E. of n=6). IR was immunoprecipitated prior to blotting. IR and Akt mass blots are included for comparison. *p≤0.05; **p≤0.01

