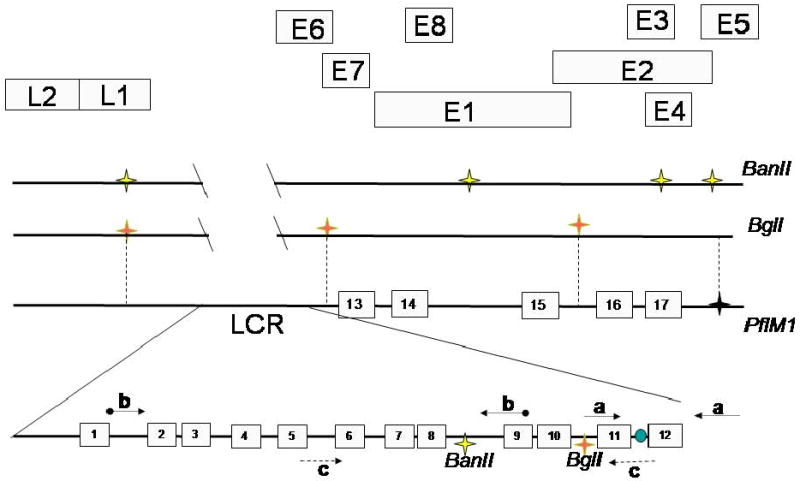
Figure 1.

Schematic of the BPV-1 genome showing E1 and E2 binding sites. E2 binding sites are shown as numbered boxes 1-17. Symbols on the upper line represent BanII restriction sites outside the viral LCR. The viral origin is depicted between E2 sites 11 and 12. The LCR sense and antisense primers which flank the BglI and BanII cut sites are represented by dashed arrows; the primers for the origin are shown as simple arrows, with the primers for the upstream region of the LCR which flank only the BanII cut site represented by ball and arrow. The letters A, B and C represent primer pairs listed in Materials and methods.
