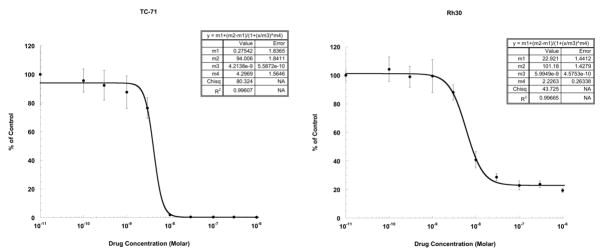
Figure 1. Ispinesib in vitro activity.
The figures illustrate typical cytotoxicity/growth inhibition dose-response curves for cell lines with T/C% values at 1 μM approaching 0% (TC-71) and for cell lines with T/C% values at 1 μM indicating a plateau agent effect of 10% or greater (Rh30). Error bars represent standard deviations for each concentration tested.

