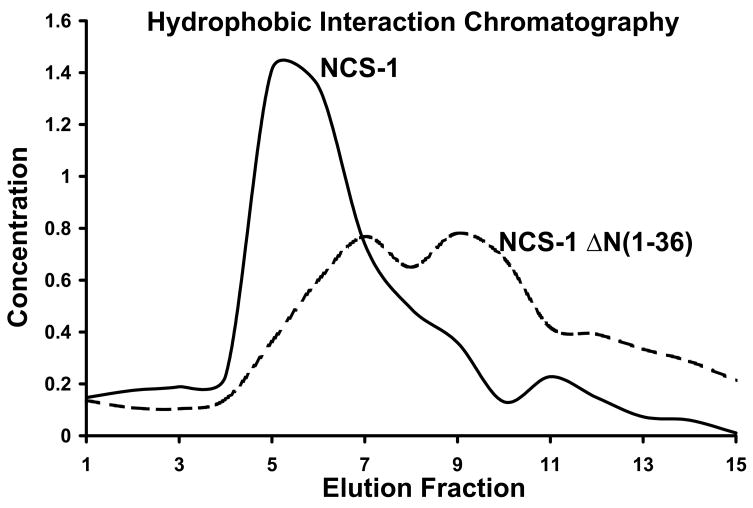
Fig. 2. HIC chromatograms of NCS-1 and ΔNCS-1(1–36) show changes in exposed hydrophobic surface area upon μ-calpain cleavage.
NCS-1 (solid trace) and ΔNCS-1(1–36) (dashed trace) were purified by HIC and resulting elution fractions were quantified using Bradford protein assay. NCS-1 elutes as a sharp peak in the presence of EDTA whereas ΔNCS-1(1–36) displays a much broader elution profile indicative of multiple conformational states or changes in exposed hydrophobic surface area.

