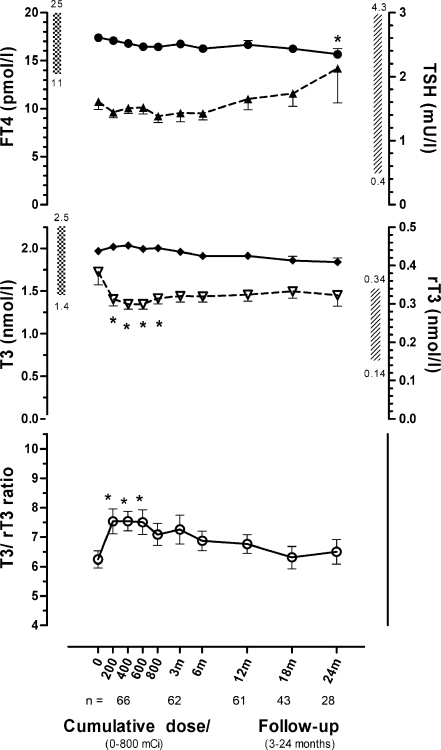
Fig. 3.
Longitudinal analysis of mean (± SEM) serum levels of TSH (dotted line with filled triangles), FT4 (black line with filled circles), T3 (black line with filled diamonds), rT3 (dotted line with open triangles) and T3/ rT3 ratio (line with open circles) of 66 patients with SSTR-positive tumours before, during and up to 24 months after 600–800 mCi 177Lu-octreotate therapy. Bars along both y-axes represent the reference range (4 SD) values, *p < 0.05

