
Figure 3.
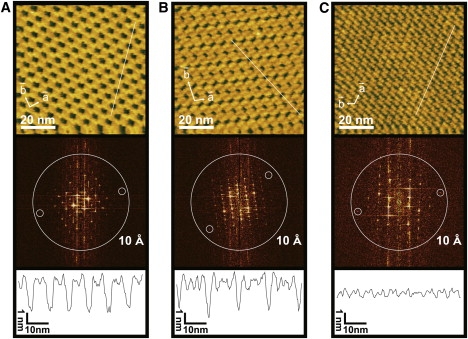
High magnification surface topographies of the streptavidin 2D crystals formed on mica-supported lipid bilayer. The space group symmetries of the crystals are (A) type-1 P2, (B) type-2 P2, and (C) type-3 P2. (Top) AFM images of the streptavidin 2D crystals. These AFM images were obtained at an imaging rate of 1 s/frame with 256 × 256 pixels. (Middle) Calculated diffraction patterns from the AFM images shown in the top panels. The large circles indicate the position of 1 nm−1. The small circles surround diffraction spots with the apparent highest resolution detected. In the reciprocal lattice, the diffraction spots can be discerned up to (5, −1) for the type-1 P2, (4, 4) for the type-2 P2, and (3, −4) for the type-3 P2, corresponding to the apparent resolutions of 1.14, 1.19, and 1.17 nm, respectively. Note that these values do not necessarily represent the spatial resolution of the images because of an effect of tip-contouring (32). (Bottom) Cross sections of the surface profiles along the lines indicated in the AFM images in the top panels.