
Figure 8.
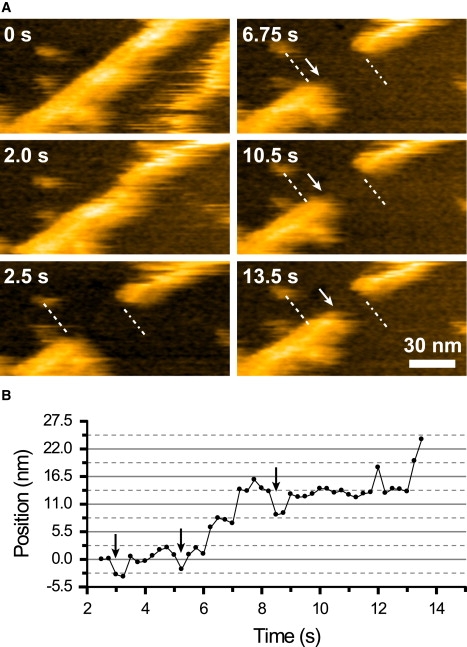
Polymerization process at actin filament ends observed by high-speed AFM. (A) High-speed AFM images of partially biotinylated actin filaments on the streptavidin type-2 P2 crystal that is chemically fixed with glutaraldehyde. The dashed lines and dot-dash lines indicate the initial positions of the barbed and pointed ends, respectively. The ends were produced by partially dissecting the filament by an oscillating cantilever tip. The arrows indicate the positions of the growing barbed end of the dissected actin filament. The successive images were obtained at an imaging rate of 0.25 s/frame with 256 × 128 pixels. Z scale: 11 nm. (B) Change with elapsed time in the barbed-end position along the longitudinal axis of the filament. The position was measured from the successive AFM images. The arrows indicate decrease in the length of the filament.