
Figure 3.
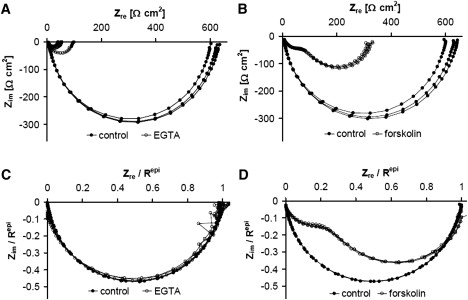
Nyquist plot of impedance spectra recorded from a HT-29/B6 cell layer in the absence and presence of EGTA (A and C) and forskolin (B and D). (A) Parameters (mean ± SE) obtained from the three control spectra are Rsub, 5.80 ± 0.13 Ω × cm2; Repi, 615.5 ± 9.4 Ω × cm2; Cepi, 4.63 ± 0.03 μF/cm2. Simultaneously measured fluorescein flux increased from 0.10 ± 0.01 nmol/cm2/h (n = 3) under control conditions by a factor of 20 at an Repi−EGTA of 56 Ω × cm2. This allowed to calculate Rtrans to 1300 Ω × cm2, to 1170 Ω × cm2 and to 58.5 Ω × cm2 (Eqs. 1 and 2). (B) Parameters (mean ± SE) obtained from the three control spectra: Rsub, 6.90 ± 0.11 Ω × cm2; Repi, 618.5 ± 12.8 Ω × cm2; Cepi, 3.93 ± 0.04 μF/cm2. The simultaneously measured fluorescein flux remained virtually unchanged (control, 0.31 ± 0.05 nmol/cm2/h; forskolin 0.26 ± 0.03 nmol/cm2/h). Without further information, Rtrans and Rpara cannot be determined from these data. (C and D) Same as A and B, but normalized with respect to Repi to illustrate, that changes in the paracellular pathway (EGTA application, C) did not alter the general shape of the curves. In contrast, changing the transcellular pathway by forskolin-induced Cl− secretion, greatly alters the general shape of the curves (D).