
Figure 5.
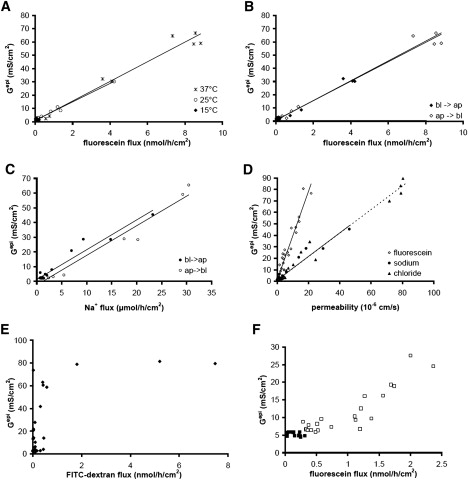
(A) Gepi versus fluorescein flux was independent of temperature in the range of 15°C to 37°C. Line, linear regression; slopes 7.4 × 10⁶ S × h/mol (37°C), 7.0 × 10⁶ S × h/mol (25°C). (B) Gepi versus fluorescein flux was independent of the flux direction (basolateral to apical, ♦; apical to basolateral, ♢, slopes of regression lines 7.5 × 10⁶ S × h/mol and 7.4 × 10⁶ S × h/mol, respectively). (C) In contrast, Gepi versus Na+ flux was clearly dependent of the flux direction (basolateral to apical, •; apical to basolateral, ○). Slopes of regression lines were similar (2.03 × 10³ S × h/mol and 2.01 × 10³ S × h/mol, respectively) but values in the apical to basolateral direction were shifted along the x axis, indicating a transcellular Na+ flux under these conditions. Gtrans calculated from data in the basolateral to apical direction was similar to Gtrans calculated from fluorescein flux (Fig. 4A) and amounted to 1.05 mS/cm2 (Rtrans = 950 Ω × cm2), whereas in the apical to basolateral direction a calculation of Gtrans would yield a value of −2.42 mS/cm2 (Rtrans = −410 Ω × cm2). (D) Comparison of Gtrans versus flux of fluorescein (♢), Na+ (basolateral to apical, ♦) and Cl− (apical to basolateral, ▴). The y-intercepts under these three conditions result in a mean Gtrans of 0.88 mS/cm2 (Rtrans = 1140 Ω × cm2). The slopes for Na+ (1.029 × 10³ S × s/cm3) and Cl− flux (1.031 × 10³ S × s/cm3) were very similar, indicating, that HT-29/B6 cell layers do not discriminate between these two ions. The slope for fluorescein was larger (3.9 × 10³ S × s/cm3), i.e., fluorescein permeability lower, as expected for an ion of larger diameter. (E) In contrast to fluorescein, Gepi versus 10 kDa FITC-dextran flux did not result in a straight line, indicating that 10 kDa FITC-dextran does not pass through the same paracellular pores as the ions determining paracellular conductance. (F) In Caco-2 cell layers Gepi versus fluorescein flux (apical to basolateral) did not yield a straight line (values the absence ■ and presence □ of EGTA). Therefore, fluorescein flux should not be used to estimate Gtrans in these cells.