
Figure 2.
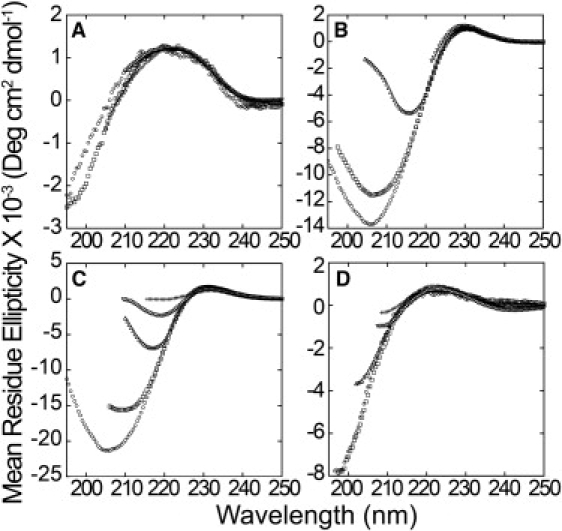
Concentration dependency of the CD spectra of peptides. Peptides were in 10 mM sodium phosphate, pH 7.00, and at 25°C. (A) R3GQ3GY at 73 (○), 95 (□), 241 (▵), 500 (▿), and 1000 (+) μM. (B) R3GQ3P11GY at 66 (○), 110 (□), 260 (▵), 500 (▿), and 1000 (+) μM. (C), R3GP11GY at 50 (○), 100 (□), 250 (▵), 500 (▿), and 1000 (+) μM. (D) R3AQ3AY at 50 (○), 100 (□), 250 (▵), 500 (▿), and 1000 (+) μM. PolyP-containing peptides show changes in spectra as concentration is increased, suggesting self-association.