
Figure 6.
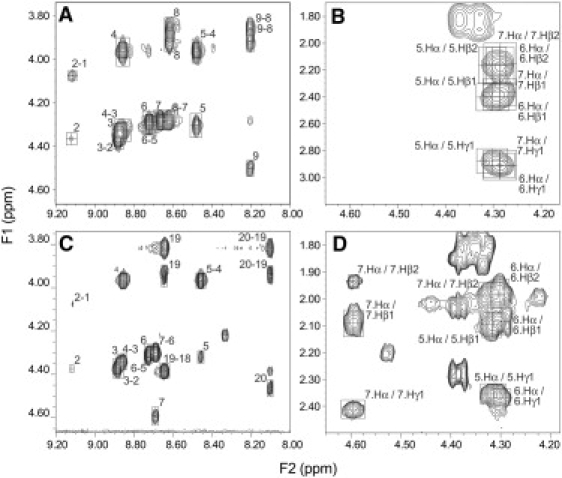
NOESY spectra of R3GQ3GY (A and B), and R3GQ3P11GY (C and D). R3GQ3GY concentration is 3.80 mM and R3GQ3P11GY concentration is 2.68 mM, both samples in 200 mM sodium phosphate (with 0.1% NaN3, w:v), pH 7.00, 5°C. A and C show the “footprint” (HN-Hα) region of the NOESY spectra of these peptides. B and D highlight NOEs between Cα protons of each of the three Gln residues and both Cβ and Cγ protons of the same residue. Numbers in the figure refer to the residue numbers in the two peptides.