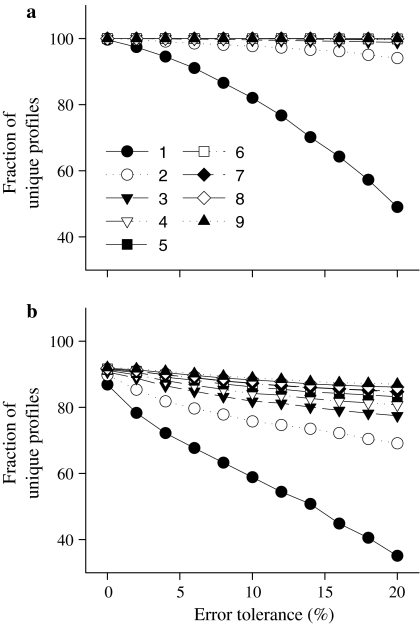
Fig. 1.
Proportion of profiles unique to a single genus (a) and to a single species (b), defined as the number of profiles specific to a single genus or species, respectively, divided by the total number of profiles. Both are dependent on the error tolerance (the x-axis) and on the number of restriction enzymes used. The number indicates the number of restriction enzymes used

