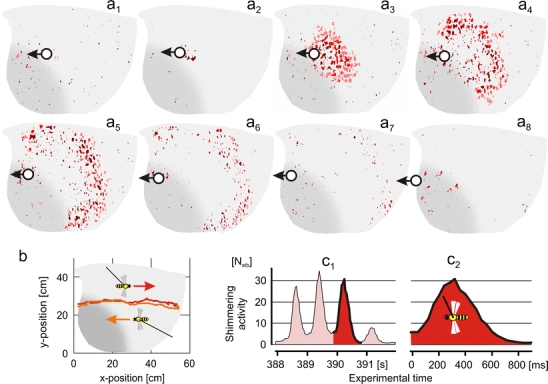
Fig. 1.

Example of a shimmering wave produced by the giant honeybee test colony in the presence of a tethered wasp. a 1 –a 8 Twenty-two sequential images disclose abdominal movements of nest bees, assembled and superimposed in eight charts: a 1 three images recorded prior to the onset of the shimmering wave; a 2 image showing the group of bees that had started the wave (dark red spots); a 3 –a 7 six charts with three images each displaying the subsequent spreading of the wave over the nest surface; a 8 three images after the wave had ceased. Successive frames were superimposed and coloured from dark to bright red. Grey areas on the left bottom side of the charts signify the ‘mouth zone’; complimentary bright grey areas signify the ‘quiescent zone’ of the nest. The positions of the tethered wasp are given by full white circles; the direction of its movement is marked by black arrows. b Single stimulation in which the tethered wasp was drawn from the left to the right side (red symbols) of the experimental nest and afterwards back to the left (orange symbols); during this experiment, the vertical position of the wasp and its distance from the nest (15 cm) were kept within narrow limits. c 1, c 2 Time plots of waving strength of the sample waves; ordinate shows the number of abdomen-thrusting bees per frame (N atb); red (c 1,c 2) refers to the sample wave displayed in (a 1 –a 8); abscissa, the experimental time in seconds (c 1) and the time course of the sample wave in millisecond (c 2)
