
Figure 1.
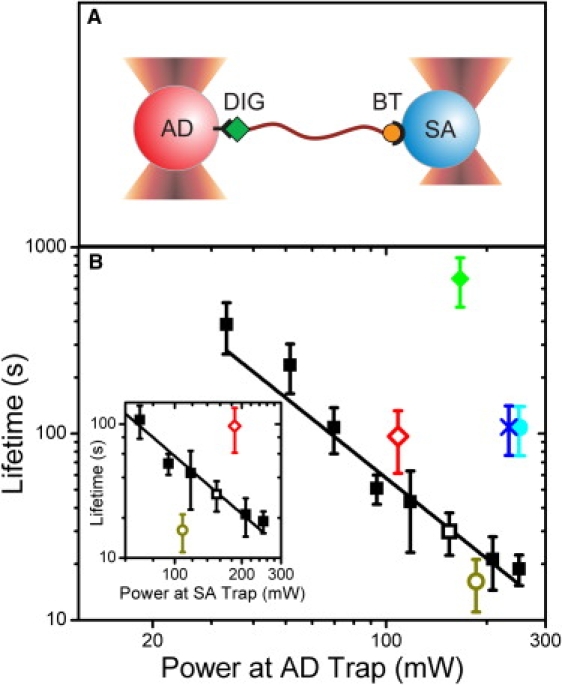
Dependence of tether lifetime on trap power. (A) Schematic representation of a dsDNA tether with 5′-digoxigenin (labeled DIG) and 5′-biotin (BT) modifications held between an anti-digoxigenin (AD, red) and a streptavidin (SA, blue) microsphere. (B) Tether lifetime versus laser power measured at the AD microsphere. Average lifetimes of tethers formed between 0.86-μm AD and 0.79-μm SA microspheres in traps of identical power (black squares, N = 18–55), and asymmetric power, with the AD microsphere in the low-power trap (open red diamond, N = 23) and high-power trap (open dark yellow circle, N = 22). Open symbols represent tethers under identical total trap power. Average lifetime of tethers formed between 2.1-μm AD and SA microspheres (cyan circle, N = 29), between a 2.1-μm AD microsphere and a 0.79-μm SA microsphere (blue X, N = 16) and between two 0.79-μm SA microspheres through dual biotin-streptavidin linkages (green diamond, N = 8). Inset: Above data plotted as a function of laser power measured at the SA microsphere. All tethers were held at tensions of 10–20 pN (14 ± 3 pN; mean ± SD, N = 268). Error bars = SE. Power-law fit to tether lifetime versus trap power measured at the AD microsphere yields the equation t = A × PB with A = (3.9 ± 2.0) × 105 s/mW and B = −1.66 ± 0.12, (χ2 = 13.7).