
Figure 4.
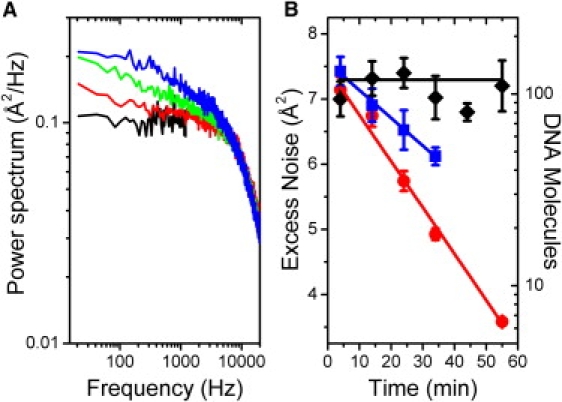
DNA dissociation from microspheres. (A) Power spectra of a heavily DNA-coated AD microsphere (∼230 mol/ microsphere) at t = 4 min (blue), 14 min (green), and 34 min (red) and an AD microsphere with no DNA (black). (B) Excess integrated noise between 0 and 100 Hz as a function of time for 0.79-μm SA (blue squares), 0.86-μm AD (red circles), and 0.97-μm SA silica (black diamonds) DNA-coated microspheres exposed to 350 mW of laser power. Error bars = SE from five power spectra. Red, blue, and black lines are trend lines to guide the eye.