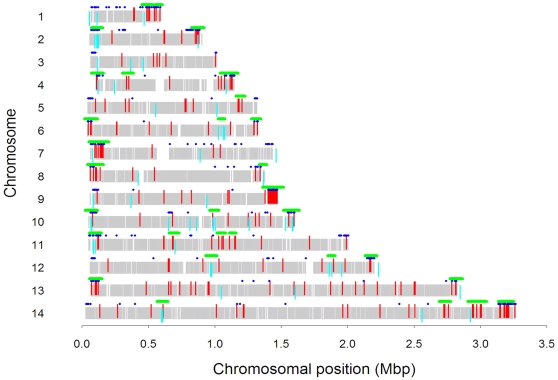
Figure 3. Chromosomal Location of Genes Differentially Expressed between Field and Laboratory Strains.
Chromosomal locations of genes that had significantly (P<0.01, >1.5-fold difference) higher (red) or lower (light blue) expression levels in field vs. laboratory strains in at least half of their probes. Regions in which there were significantly more (P<0.05) differentially regulated genes than expected by chance (i.e., clustering) are indicated by a green bar above the chromosome. Genes belonging to the exportome are indicated by blue dots above the chromosome. Vertical grey bars indicate the locations of genes included in these analyses.

